
At Cloudflare we handle a lot of traffic on behalf of our customers. Something we all see and hear a lot about at this time of year are Black Friday (23 November this year) and Cyber Monday (26 November) - but just how important are these days on the Internet?

To try and answer this question, we took a look at anonymised samples of HTTP requests crossing our network. First of all, let’s look at total page views from across our global network from the last few weeks and see if we can spot Black Friday and Cyber Monday:
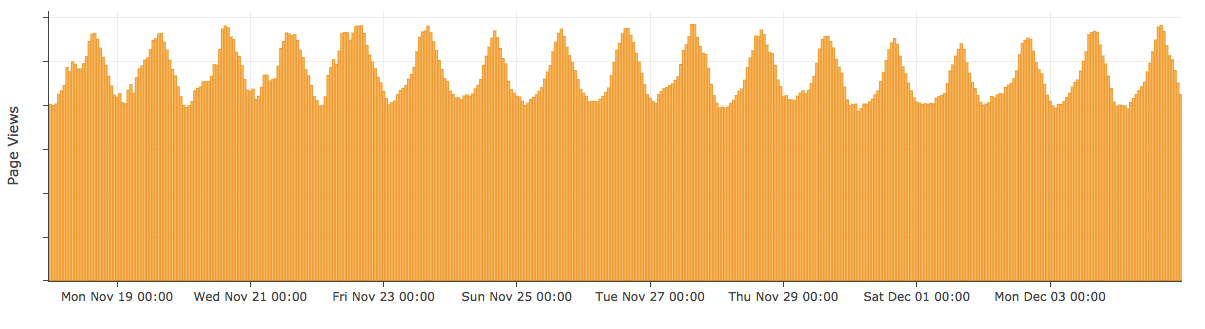
So this is total page views by day (UTC) from November 19 (a week before Cyber Monday) until Monday December 3. Other than follow-the-sun fluctuations in a repeating daily pattern, each whole day is pretty similar in shape and size compared to the last. Black Friday and Cyber Monday aren’t visible in overall traffic patterns.
Get specific
We have a very diverse set of customers across 12 million domain names and not all of them are selling products or doing so directly online. To identify those websites that are, I used metadata from the wonderful HTTP Archive project to export a list of domains using Cloudflare that were also running ecommerce software.
Here are the page views for these ecommerce sites over the same time period:
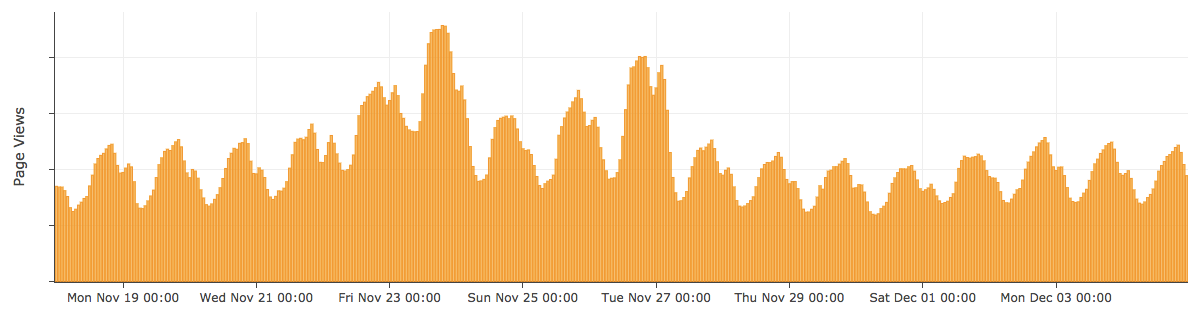
So we can see clearly that our ecommerce customers are seeing a big increase in page views on November 23 and 26. Black Friday and Cyber Monday are most certainly a thing. This year Black Friday was quite a bit busier than Cyber Monday - around 22% busier in terms of page views. If we compare the page views of each day to the week prior, we can see the changes clearly:
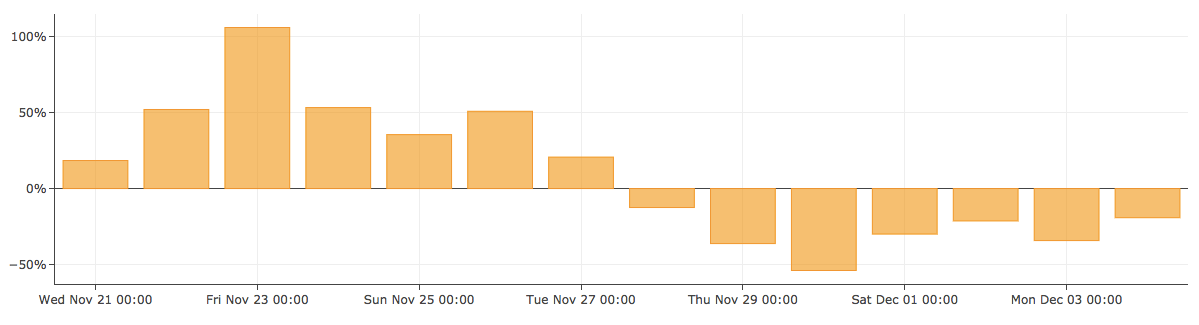
The uplift starts on Wednesday but really kicks in during Thanksgiving with an increase of more than 100% on Black Friday.
Browsing vs Buying
So we’ve established that these shopping days are important in terms of visitor activity. More pages are being viewed on these days - but is anyone buying anything?
We’re dealing with trillions of requests across a really large data set of different websites without any specific knowledge of what a purchase transaction would look like for each - so to approximate this I took a crude approach, which is to look for successful checkout interactions in the data. If you imagine a typical ecommerce application makes a purchase with a HTTP request like “POST /store/checkout HTTP/1.1” we can look for requests similar to this to understand the activity.
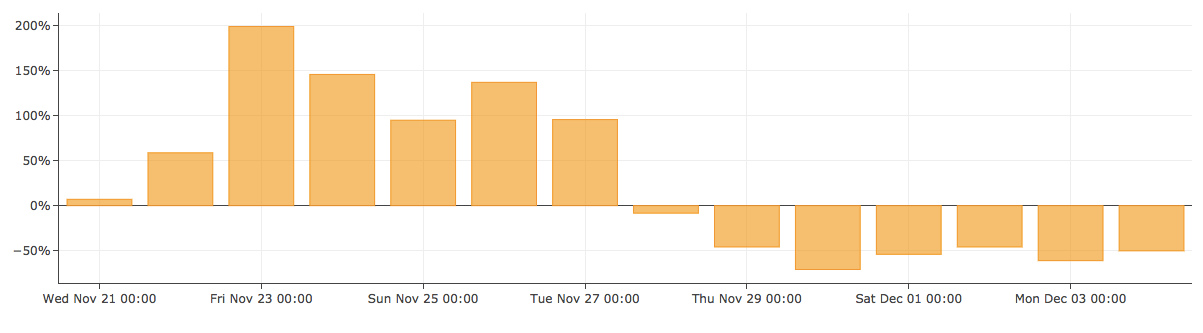
We can see here that Black Friday has an almost 200% increase in checkout interactions compared to the previous Friday.
Using this raw number of checkout interactions to compare with the page views we have something approximating a conversion %. This is not a true conversion figure - calculating a true conversion figure would require data that identifies individuals and detailed action tracking for each website. What we have is the total number of page views (HTTP requests that return HTML successfully) compared to the total number of POST requests to a checkout. This gives us a baseline to compare changes in “conversion” over these big November shopping days:
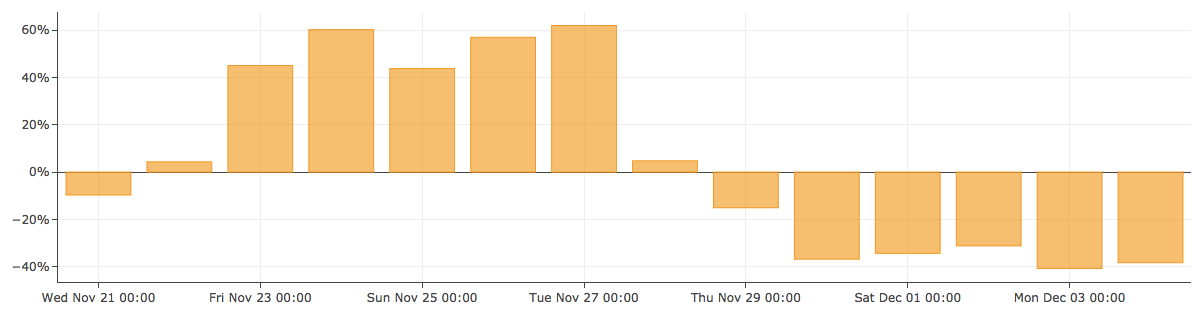
Each bar on this chart represents the % change in checkout interactions as a proportion of page views compared to the same day the previous week. We can see this increased by 45% on Black Friday compared to the Friday before (boring old beige Friday November 16). The following Saturday was booming at 60% - because we’re dealing with time in UTC, a UTC Saturday actually includes Black Friday traffic for some parts of the world, the same can be said of Tuesday which contains overlap from Cyber Monday - we’ll break this down a bit later.
On Cyber Monday, the increase actually beats Black Friday, meaning page views lead to cart interactions 57% more often than the prior Monday (boring old vanilla Monday November 19), albeit from a lower number of transactions.
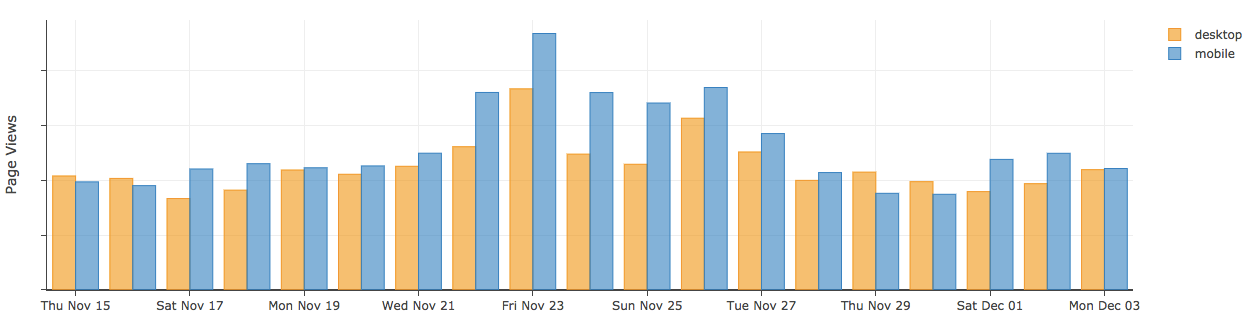
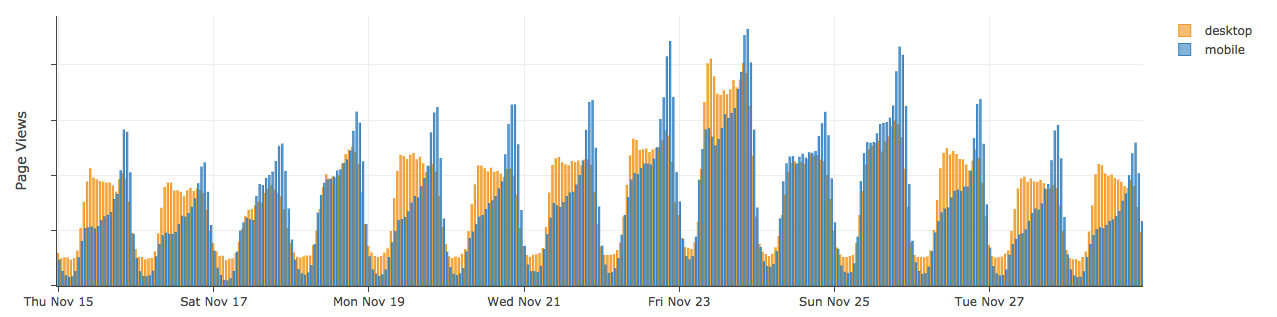
What devices are people buying on?
What we see here is just how much more browsing people do on mobiles today vs desktop, with mobile winning most days:
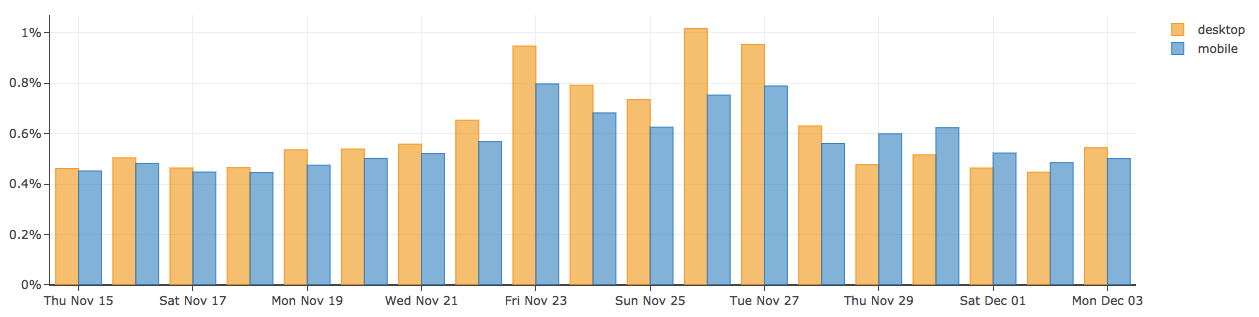
When it comes to checkout interactions though, we can see the situation is switched with visitors more likely to interact with the checkout on a desktop overall, but even more so on Black Friday (14% more likely) and Cyber Monday (20% more likely).
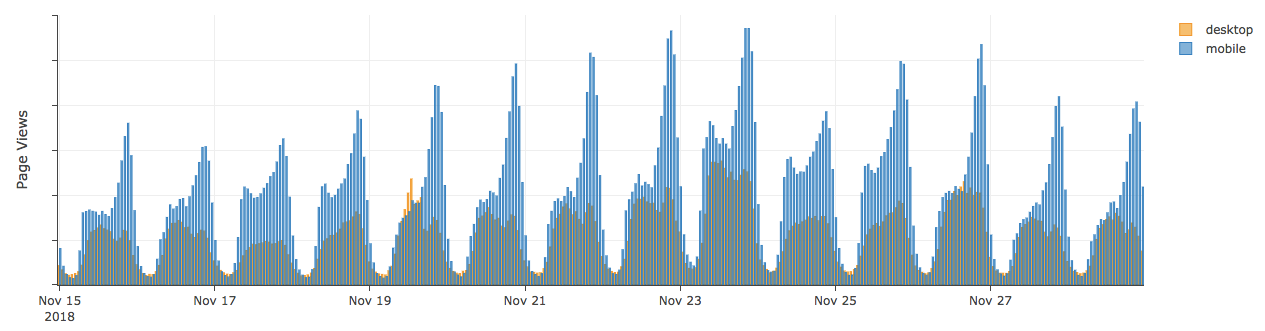
Let’s look at a specific region to understand more, starting with the US:
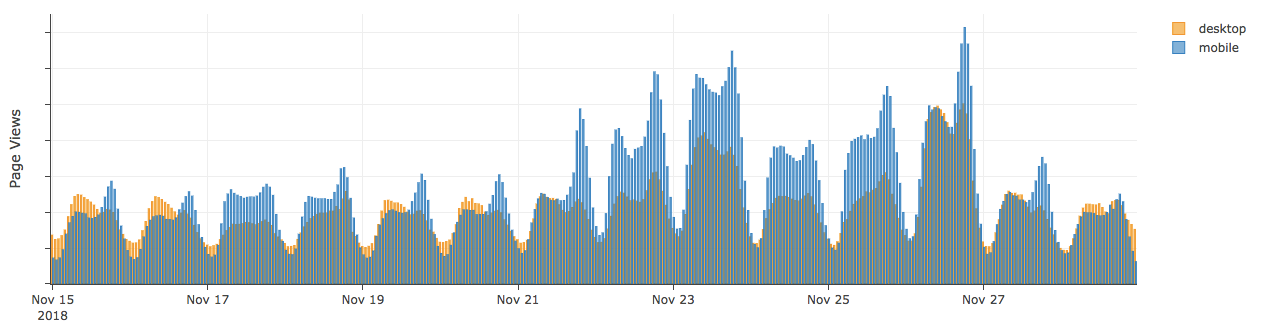
We can see a more normal weekday pattern on the prior Thursday & Friday (15 & 16 Nov) whereby desktop page views eclipse mobile during the daytime while people are at their desks. In the evenings and weekends, mobile takes over. What we see from the 21st onward is evidence of people taking time off work and doing more with their mobile devices. Even on Thanksgiving, there is still a big rise in activity as people start gearing up for Friday’s deals or finding ways to avoid political discussion with relatives at home!
On Cyber Monday, traffic earlier in the day is lower as people return to work, however we are seeing heavy use of desktop devices. As the working day ends, mobile once again dominates. Things begin to settle back into a more regular pattern from Tuesday November 27 onwards.
Let's take a look at checkout interaction over the Black Friday to Cyber Monday weekend by device type.
Despite all of that mobile browsing activity, desktop devices are more commonly used for checkout actions. People seem to browse more on mobile, committing to buy more often with desktop, it may also just be that mobile users have more distractions both on the device and in the real world and are therefore less likely to complete a purchase. From personal experience, I also think the poor mobile optimisation of some sites’ checkout flows make desktop preferrable - and when customers are incentivised with discounts & deals, they are more likely to switch devices to complete a transaction if they hit an issue.
Is Black Friday / Cyber Monday international?
It might be obvious if you’re reading this from the UK, but despite the fact that Thanksgiving is not a holiday here, retailers have very much picked up the mantle from US retailers and seized the opportunity to drive sales over this weekend.
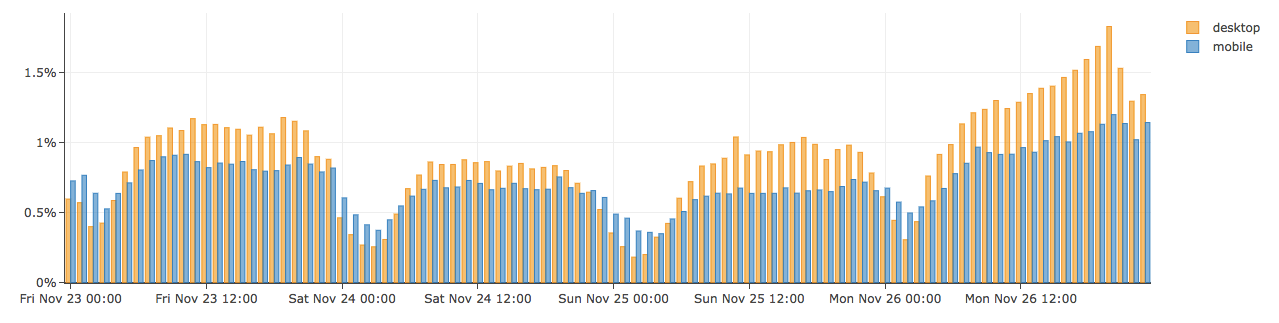
Page views to ecommerce websites on Cloudflare look very similar in shape to the US on Black Friday. However, mobile is more dominant in the UK, even during working hours. It’s worth noting one big difference here - Cyber Monday in the UK was only 22% up in terms of page views compared to the prior Monday - in the US the increase was more than 4x that.
When it comes to checkout, it also looks like UK visitors to ecommerce sites commit more with their mobile, but desktop is still more likely to lead to more conversion.
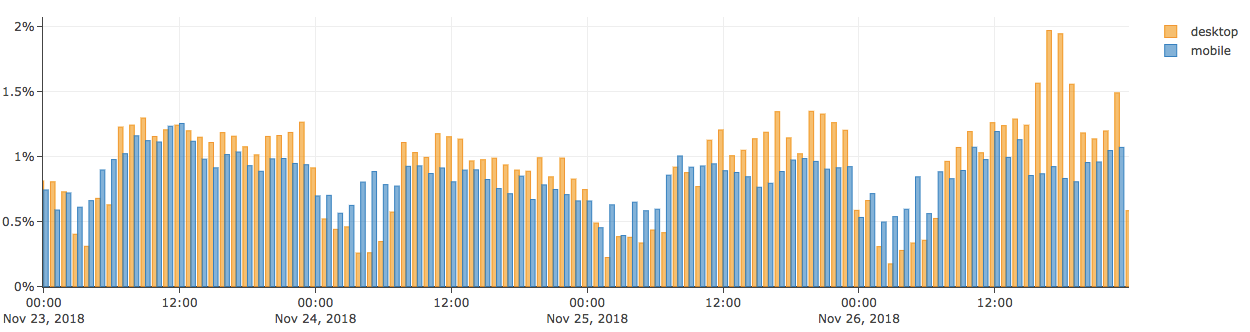
Taking Germany as another example, here’s how page views look:
Desktop use during typical working hours is much more pronounced in Germany. Black Friday and Cyber Monday show higher page views than a normal Friday / Monday but the difference is much smaller than regions such as the US & UK.
Conclusions
Black Friday is spreading internationally despite these still being normal working days for the rest of the world. Cyber Monday is also increasing ecommerce activity internationally but tends to be quieter than Black Friday. Overall, mobile browsing eclipses desktop, but those desktop page views tend to lead to checkout more often.
Retailers should continue to invest in making their mobile & desktop ecommerce experiences fast & resilient to seize on these key days.